FONDO NACIONAL DE FINANCIAMIENTO DE LA ACTIVIDAD EMPRESARIAL DEL ESTADO FONAFE
FOEPR086
Fecha Cierre:
15/08/2013
Hora Cierre:
19.25.27
Página
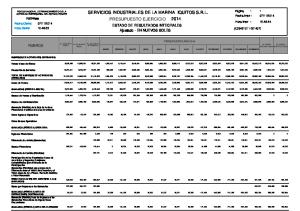
SERVICIOS INDUSTRIALES DE LA MARINA IQUITOS S.R.L. PRESUPUESTO EJERCICIO 2013 ESTADO DE SITUACIÓN FINANCIERA Ajustado - EN NUEVOS SOLES
:
1
Fecha Impr :
15/08/2013
Hora Impr :
19.46.38
(C27251908-201315)
PRESUPUESTO AÑO 2013
RUBROS
AL 31/12/2010 (REAL)
AL 31/12/2011 (REAL)
AL 31/12/2012 (ESTIMADO)
31/12/2014 31/12/2015 (PROYECTADO) (PROYECTADO) ENERO
FEBRERO
MARZO
ABRIL
MAYO
JUNIO
JULIO
AGOSTO
SETIEMBRE
OCTUBRE
NOVIEMBRE
DICIEMBRE
ACTIVO ACTIVO CORRIENTE Efectivo y Equivalentes al Efectivo
3,078,053
2,944,488
8,719,292
19,745,622
17,857,897
15,765,456
11,343,548
8,921,777
6,465,504
988,312
2,162,279
2,628,303
4,176,443
6,193,995
5,193,944
5,592,185
5,926,244
5,308,911
13,519,528
13,967,513
1,658,065
1,637,455
1,826,666
2,653,836
7,115,922
7,924,655
4,253,836
3,153,858
4,965,987
5,651,236
4,353,889
6,653,954
4,876,213
4,876,213
197,094
64,547
51,517
51,290
35,047
87,308
85,766
152,903
113,435
65,766
62,725
56,754
54,821
53,766
51,657
55,000
55,000
7,424,625
3,264,765
5,559,037
7,301,294
6,882,493
8,463,434
8,157,089
5,837,036
7,121,387
8,911,489
10,436,031
7,553,350
8,008,478
8,442,857
10,157,616
7,568,580
7,856,210
126,065
138,116
331,053
370,049
374,885
426,634
3,908,958
712,705
697,509
4,426,634
826,634
626,634
422,434
395,634
336,634
320,000
320,000
16,134,748
19,931,444
28,628,412
29,126,320
26,787,777
26,569,498
26,149,197
22,740,343
22,322,490
18,646,037
16,641,527
15,831,028
18,313,412
19,440,141
22,393,805
18,411,978
19,033,667
1,455,588
1,455,588
1,455,588
1,455,588
1,455,588
1,455,588
1,455,588
1,455,588
1,455,588
1,455,588
1,455,588
1,455,588
1,455,588
1,455,588
1,455,588
1,455,588
17,034,038
19,432,156
20,067,150
20,070,396
19,995,230
19,909,712
19,853,160
19,810,385
19,736,338
19,666,338
19,596,338
19,526,338
19,461,338
19,416,338
19,374,338
19,304,338
19,234,338
86,833
661,337
941,623
941,623
941,623
941,623
941,623
941,623
867,146
854,573
842,000
829,427
816,854
804,281
791,708
642,708
493,708
120,710
120,710
120,710
120,710
120,710
120,710
120,710
120,710
120,710
120,710
120,710
120,710
109,500
110,000
110,000
Inversiones Financieras Cuentas por Cobrar Comerciales (Neto) Otras Cuentas por Cobrar (Neto) Cuentas por Cobrar a Entidades Relacionadas
Inventarios Activos Biológicos Activos No Corrientes Mantenidos para la Venta Activos por Impuestos a las Ganancias Gastos Pagados por Anticipado Otros Activos TOTAL ACTIVO CORRIENTE ACTIVO NO CORRIENTE Cuentas por Cobrar Comerciales Otras Cuentas por Cobrar Cuentas por Cobrar a Entidades Relacionadas
Activos Biológicos Inversiones Mobiliarias (Neto) Propiedad de Inversión Propiedades,Planta y Equipo (Neto) Activos Intangibles (Neto) Activos por Impuestos a las Ganancias Diferidos
Otros Activos TOTAL ACTIVO NO CORRIENTE
17,120,871
21,549,081
22,585,071
22,588,317
22,513,151
22,427,633
22,371,081
22,328,306
22,179,782
22,097,209
22,014,636
21,932,063
21,854,490
21,796,917
21,731,134
21,512,634
21,293,634
TOTAL ACTIVO
33,255,619
41,480,525
51,213,483
51,714,637
49,300,928
48,997,131
48,520,278
45,068,649
44,502,272
40,743,246
38,656,163
37,763,091
40,167,902
41,237,058
44,124,939
39,924,612
40,327,301
6,491,105
16,218,596
17,620,301
25,873,730
23,132,506
23,439,328
23,440,222
23,444,212
17,713,702
17,900,000
17,900,000
17,900,000
17,900,000
17,900,000
17,900,000
15,800,000
15,800,000
10,402,296
14,185,951
11,566,354
13,755,324
12,993,109
15,124,792
15,565,127
11,048,592
11,810,359
10,700,000
9,500,000
9,500,000
10,890,000
11,200,000
11,635,000
10,500,000
10,500,000
Otras Cuentas por Pagar
570,906
835,084
492,275
432,133
648,776
657,333
696,931
727,205
715,463
696,931
696,931
696,931
696,931
696,931
696,931
650,000
650,000
Cuentas por Pagar a Entidades Relacionadas
588,747
306,985
437,517
451,081
458,351
473,333
444,834
441,458
442,099
444,834
444,834
444,834
444,834
444,834
444,834
450,000
450,000
325,798
413,463
594,323
517,876
604,790
505,878
602,290
520,000
520,000
520,000
520,000
520,000
520,000
505,000
505,000
15,328,020
12,821,944
15,052,001
14,694,559
16,773,334
17,311,682
12,723,133
13,570,211
12,361,765
11,161,765
11,161,765
12,551,765
12,861,765
13,296,765
12,105,000
12,105,000
2,687,442
1,930,089
1,930,089
1,930,089
1,752,121
1,752,121
1,752,121
1,571,506
1,571,507
1,571,507
1,387,486
1,387,486
1,387,486
1,199,702
793,933
354,007
1,607,542
1,526,206
1,526,206
1,526,206
1,526,206
1,526,206
1,526,206
1,526,206
1,526,206
1,526,206
1,526,206
1,526,206
1,526,206
1,439,206
1,352,206
1,265,206
13,265,511
11,753,786
9,679,137
7,360,332
6,118,644
7,235,493
6,071,857
3,518,678
2,646,452
2,146,635
3,228,687
4,178,664
6,423,651
3,780,544
4,569,563
Cuentas de Orden PASIVO Y PATRIMONIO PASIVO CORRIENTE Sobregiros Bancarios Obligaciones Financieras Cuentas por Pagar Comerciales
Provisiones Pasivos Mantenidos para la Venta Pasivos por Impuestos a las Ganancias Beneficios a los Empleados Otros Pasivos TOTAL PASIVO CORRIENTE
11,561,949
PASIVO NO CORRIENTE Obligaciones Financieras Cuentas Pagar Comerciales Otras Cuentas por pagar Cuentas por pagar a Entidades Relacionadas Pasivo por impuesto a las Ganancias Diferidos
1,790,041
Provisiones Beneficios a los Empleados Otros Pasivos Ingresos Diferidos (Neto) TOTAL PASIVO NO CORRIENTE TOTAL PASIVO
1,790,041
4,294,984
16,721,806
15,210,081
13,135,432
10,638,659
9,396,971
10,513,820
9,169,569
6,616,391
5,744,165
5,060,327
6,142,379
7,092,356
9,062,559
5,926,683
6,188,776
13,351,990
19,623,004
29,543,750
30,262,082
27,829,991
27,411,993
26,708,653
23,236,953
22,739,780
18,978,156
16,905,930
16,222,092
18,694,144
19,954,121
22,359,324
18,031,683
18,293,776
23,017,670
23,017,670
23,035,275
23,035,275
23,035,275
23,035,275
23,035,275
23,035,275
23,035,275
23,035,275
23,035,275
23,035,275
23,035,275
23,035,275
23,035,275
23,035,275
23,035,275
PATRIMONIO Capital
Acciones de Inversión 17,608
208,008
190,403
190,403
190,403
190,403
190,403
190,403
190,403
190,403
190,403
190,403
190,403
190,403
190,403
190,403
190,403
5,137,816
3,750,930
3,561,146
3,561,146
3,561,146
3,561,146
3,561,146
3,561,146
3,561,146
3,561,146
3,561,146
3,561,146
3,561,146
3,561,146
3,374,146
3,187,146
3,000,146
337,106
337,106
337,106
337,106
337,106
337,106
337,106
337,106
337,106
337,106
337,106
337,106
337,106
337,106
337,106
337,106
337,106
-8,606,571
-5,456,193
-5,454,197
-5,671,375
-5,652,993
-5,538,792
-5,312,305
-5,292,234
-5,361,438
-5,358,840
-5,373,697
-5,582,931
-5,650,172
-5,840,993
-5,171,315
-4,857,001
-4,529,405
TOTAL PATRIMONIO
19,903,629
21,857,521
21,669,733
21,452,555
21,470,937
21,585,138
21,811,625
21,831,696
21,762,492
21,765,090
21,750,233
21,540,999
21,473,758
21,282,937
21,765,615
21,892,929
22,033,525
TOTAL PASIVO Y PATRIMONIO
33,255,619
41,480,525
51,213,483
51,714,637
49,300,928
48,997,131
48,520,278
45,068,649
44,502,272
40,743,246
38,656,163
37,763,091
40,167,902
41,237,058
44,124,939
39,924,612
40,327,301
6,491,105
16,218,596
17,620,301
25,873,730
23,132,506
23,439,328
23,440,222
23,444,212
17,713,702
17,900,000
17,900,000
17,900,000
17,900,000
17,900,000
17,900,000
15,800,000
15,800,000
Capital Adicional Resultados no Realizados Reservas Legales Otras Reservas Resultados Acumulados Otras Reservas de Patrimonio
Cuentas de Orden
FONDO NACIONAL DE FINANCIAMIENTO DE LA ACTIVIDAD EMPRESARIAL DEL ESTADO FONAFE
FOEPR086
Fecha Cierre:
15/08/2013
Hora Cierre:
19.25.42
Página
SERVICIOS INDUSTRIALES DE LA MARINA IQUITOS S.R.L. PRESUPUESTO EJERCICIO 2013 ESTADO DE RESULTADOS INTEGRALES Ajustado - EN NUEVOS SOLES
:
1
Fecha Impr :
15/08/2013
Hora Impr :
19.48.00
(C42251908-201315)
PRESUPUESTO AÑO 2013
RUBROS
AL 31/12/2010 (REAL)
AL 31/12/2011 (REAL)
AL 31/12/2012 (ESTIMADO)
31/12/2014 31/12/2015 (PROYECTADO) (PROYECTADO) ENERO
FEBRERO
MARZO
ABRIL
MAYO
JUNIO
JULIO
AGOSTO
SETIEMBRE
OCTUBRE
NOVIEMBRE
DICIEMBRE
INGRESOS DE ACTIVIDADES ORDINARIAS Ventas Netas de Bienes
20,803,145
Prestación de Servicios
8,978,768
13,836,941
0
993,400
3,192,016
5,721,382
6,694,334
7,397,426
8,892,504
13,702,518
14,469,589
17,592,482
18,855,000
24,757,953
14,472,835
14,928,729
12,751,241
6,012,977
46,055
1,139,942
2,238,374
3,872,918
3,987,930
5,655,280
8,309,248
8,368,655
9,002,575
9,002,575
9,002,577
15,422,141
11,411,175
11,771,271
TOTAL DE INGRESOS DE ACTIVIDADES ORDINARIAS
20,803,145
21,730,009
19,849,918
46,055
2,133,342
5,430,390
9,594,300
10,682,264
13,052,706
17,201,752
22,071,173
23,472,164
26,595,057
27,857,577
40,180,094
25,884,010
26,700,000
Costo de Ventas
16,544,931
17,819,417
15,169,888
34,542
1,913,931
4,858,436
8,479,488
9,391,211
11,488,806
15,318,181
19,885,386
21,146,278
24,019,340
25,155,608
36,245,872
21,791,420
22,478,392
GANANCIAS (PÉRDIDA BRUTA)
4,258,214
3,910,592
4,680,030
11,513
219,411
571,954
1,114,812
1,291,053
1,563,900
1,883,571
2,185,787
2,325,886
2,575,717
2,701,969
3,934,222
4,092,590
4,221,608
Gastos de Ventas y Distribución
1,040,352
1,195,444
1,705,214
87,905
143,627
198,638
285,799
346,795
507,820
598,243
688,666
779,089
869,512
959,935
1,050,359
1,015,312
1,050,000
Gastos de Administración
2,521,488
2,899,237
2,654,152
173,183
374,327
564,506
774,811
1,003,191
1,236,588
1,463,288
1,689,988
1,921,609
2,148,309
2,375,009
2,716,472
2,371,970
2,446,745
Otros Ingresos Operativos
270,945
707,609
113,779
8,633
61,686
64,663
138,067
205,060
200,540
207,790
215,040
222,290
229,540
236,790
244,040
85,000
87,679
Otros Gastos Operativos
200,787
GANANCIA (PÉRDIDA) OPERATIVA
766,532
523,520
434,443
-240,942
-236,857
-126,527
192,269
146,127
20,032
29,830
22,173
-152,522
-212,564
-396,185
411,431
790,308
812,542
Ingresos Financieros
161,135
251,564
341,366
0
0
0
0
0
0
0
0
0
0
0
0
0
0
83,481
101,564
139,605
226,954
345,223
629,470
639,720
649,970
660,220
670,470
680,720
690,970
120,000
120,000
0
0
0
0
0
0
0
0
0
0
0
0
0
0
14,908
21,222
49,965
229,298
281,355
492,222
509,672
527,122
571,911
589,361
606,811
648,177
312,000
312,000
-172,369
-156,515
-36,887
189,925
209,995
157,280
159,878
145,021
-64,213
-131,455
-322,276
454,224
598,308
620,542
231,342
283,994
292,946
Ganancia (Pérdida) de la baja de Activos Financieros medidos al Costo Amortizado
Diferencia de cambio (Ganancias) Gastos Financieros
322,407
328,091
473,649
Diferencia de Cambio (Pérdidas) Participación de los Resultados Netos de Asociadas y Negocios Conjuntos Contabilizados por el Método de la Participación Ganancias (Pérdidas) que surgen de la Diferencia entre el Valor Libro Anterior y el Valor Justo de Act. Financ. Reclasif. Medidos a Valor Razonable RESULTADO ANTES DEL IMPUESTO A LAS GANANCIAS
605,260
446,993
302,160
Gasto por Impuesto a las Ganancias
372,603
377,966
224,770
GANANCIA (PÉRDIDA) NETA DE OPERACIONES CONTINUADAS
232,657
69,027
77,390
-172,369
-156,515
-36,887
189,925
209,995
157,280
159,878
145,021
-64,213
-131,455
-322,276
222,882
314,314
327,596
232,657
69,027
77,390
-172,369
-156,515
-36,887
189,925
209,995
157,280
159,878
145,021
-64,213
-131,455
-322,276
222,882
314,314
327,596
Ganancia (Pérdida) Neta de Impuesto a las Ganancias Procedente de Operaciones Discontinuas GANANCIA (PÉRDIDA) NETA DEL EJERCICIO
COMPONENTES DE OTRO RESULTADO INTEGRAL: Ganancias (Pérdidas) Neta por Activos Financieros Disponibles para la Venta Ganancias (Pérdidas) de Inversiones en Instrumentos de Patrimonio Otros Componentes de Resultado Integral OTRO RESULTADO INTEGRAL ANTES DE IMPUESTOS IMPUESTO A LAS GANACIAS RELACIONADO CON COMPONENTES DE OTRO RESULTADO INTEGRAL Ganancias Netas por Activos Financieros Disponibles para la Venta Ganancias de Inversiones por Instrumentos de Patrimonio Otros componentes de Resultado Integral SUMA DE COMPONENTES DE OTRO RESULTADO INTEGRAL CON IMPUESTO A LAS GANANCIAS RELACIONADAS Otros resultados Integrales RESULTADO INTEGRAL TOTAL DEL EJERCICIO, NETO DEL IMPUESTO A LA RENTA
232,657
69,027
77,390
-172,369
-156,515
-36,887
189,925
209,995
157,280
159,878
145,021
-64,213
-131,455
-322,276
222,882
314,314
327,596
Depreciación:
914,193
998,121
1,048,734
85,828
171,720
257,237
342,868
428,663
516,247
602,247
688,247
774,247
860,247
946,247
1,032,247
1,044,000
1,044,000
Amortización:
465,380
283,694
150,876
74,476
87,048
99,621
112,194
124,767
137,341
149,914
149,000
149,000
FONDO NACIONAL DE FINANCIAMIENTO DE LA ACTIVIDAD EMPRESARIAL DEL ESTADO FONAFE
Página
SERVICIOS INDUSTRIALES DE LA MARINA IQUITOS S.R.L. PRESUPUESTO EJERCICIO 2013
:
2
2
Fecha Impr : 16/08/2013
Flujo de Caja Aprobado - Formulacion FECHA CIERRE : 15/08/2013
Hora Impr
EN NUEVOS SOLES
HORA CIERRE : 12.00 AM
:
7.53 AM
(C26261908-201315) PRESUPUESTO AÑO 2013
RUBROS
31.12.2010 (REAL)
31.12.2011 (REAL)
31.12.2012 (ESTIMADO)
31.12.2014 31.12.2015 (PROYECTADO) (PROYECTADO) ENERO
FEBRERO
MARZO
ABRIL
MAYO
JUNIO
JULIO
AGOSTO
SETIEMBRE
OCTUBRE
NOVIEMBRE
DICIEMBRE
TOTAL
INGRESOS DE OPERACION
17,540,523
23,738,976
25,308,863
12,363,660
60,618
9,775
117,790
974,264
514,648
3,096,495
5,409,677
3,633,774
4,233,717
3,662,323
806,864
34,883,605
23,821,233
24,812,312
Venta de Bienes y Servicios
17,497,917
23,113,829
25,034,667
12,298,802
43,951
0
0
877,476
449,208
3,096,495
5,409,677
3,633,774
4,233,717
3,662,323
806,864
34,512,287
23,821,233
24,812,312
31,907
41,011
75,754
64,858
16,527
9,775
117,790
96,788
65,440
0
0
0
0
0
0
371,178
0
0
Ingresos por participacion o dividendos
0
0
0
0
0
0
0
0
0
0
0
0
0
0
0
0
0
0
Donaciones
0
0
0
0
0
0
0
0
0
0
0
0
0
0
0
0
0
0
Ingresos Complementarios
0
0
0
0
0
0
0
0
0
0
0
0
0
0
0
0
0
0
Retenciones de tributos
0
0
0
0
0
0
0
0
0
0
0
0
0
0
0
0
0
0
10,699
584,136
198,442
0
140
0
0
0
0
0
0
0
0
0
0
140
0
0
19,635,246
25,204,424
17,518,415
1,246,991
1,777,110
1,800,840
4,537,920
3,200,183
2,752,638
8,522,087
4,172,830
2,875,590
2,554,222
1,624,571
1,565,700
36,630,682
21,588,931
22,474,653
Compra de Bienes
7,978,198
12,065,811
6,412,010
480,075
504,355
538,451
2,673,804
1,238,010
1,123,606
4,302,158
2,448,214
475,115
1,455,684
735,070
542,953
16,517,495
8,593,564
9,351,098
Gastos de personal
3,230,779
3,896,983
3,945,832
283,120
220,407
349,458
311,440
520,717
299,727
556,464
391,819
298,317
284,901
495,348
569,698
4,581,416
3,967,013
4,027,900
Servicios prestados por terceros
6,640,568
8,076,958
5,985,933
349,051
1,006,535
820,408
1,416,761
1,377,070
1,228,369
3,533,923
1,210,234
1,951,862
726,085
306,223
339,520
14,266,041
8,189,984
8,230,726
Tributos
1,467,440
805,050
923,300
116,650
33,755
77,965
106,138
62,222
65,491
114,452
107,973
135,706
72,962
73,340
98,939
1,065,593
638,370
664,929
344,300
666,906
760,388
101,937
26,470
63,627
97,406
53,343
49,479
114,452
107,973
135,706
72,962
73,340
98,939
995,634
638,370
664,929
1,123,140
138,144
162,912
14,713
7,285
14,338
8,732
8,879
16,012
0
0
0
0
0
0
69,959
0
0
81,365
104,625
84,861
11,388
8,199
177
25,497
0
18,515
9,590
9,090
9,090
9,090
9,090
9,090
118,816
110,000
110,000
236,792
254,997
166,479
6,707
3,859
14,381
4,280
2,164
16,930
5,500
5,500
5,500
5,500
5,500
5,500
81,321
90,000
90,000
104
0
0
0
0
0
0
0
0
0
0
0
0
0
0
0
0
0
-2,094,723
-1,465,448
7,790,448
11,116,669
-1,716,492
-1,791,065
-4,420,130
-2,225,919
-2,237,990
-5,425,592
1,236,847
758,184
1,679,495
2,037,752
-758,836
-1,747,077
2,232,302
2,337,659
Ingresos Financieros
Otros EGRESOS DE OPERACION
Por Cuenta Propia Por Cuenta de Terceros Gastos diversos de Gestion Gastos Financieros Otros FLUJO OPERATIVO
0
0
0
0
0
0
0
0
0
0
0
0
0
0
0
0
0
0
Aportes de Capital
0
0
0
0
0
0
0
0
0
0
0
0
0
0
0
0
0
0
Ventas de activo fijo
0
0
0
0
0
0
0
0
0
0
0
0
0
0
0
0
0
0
Otros
0
0
0
0
0
0
0
0
0
0
0
0
0
0
0
0
0
0
680,900
1,273,020
942,272
90,339
171,233
7,236
1,778
195,852
7,213
51,600
62,880
80,800
131,355
20,200
29,514
850,000
1,270,000
1,400,000 1,400,000
INGRESOS DE CAPITAL
GASTOS DE CAPITAL
680,900
1,273,020
942,272
90,339
171,233
7,236
1,778
195,852
7,213
51,600
62,880
80,800
131,355
20,200
29,514
850,000
1,270,000
Proyecto de Inversion
105,872
0
387,167
88,847
170,723
7,236
0
151,467
0
0
0
0
0
0
0
418,273
0
0
Gastos de capital no ligados a proyectos
575,028
1,273,020
555,105
1,492
510
0
1,778
44,385
7,213
51,600
62,880
80,800
131,355
20,200
29,514
431,727
1,270,000
1,400,000
Inversion Financiera
0
0
0
0
0
0
0
0
0
0
0
0
0
0
0
0
0
0
Otros
0
0
0
0
0
0
0
0
0
0
0
0
0
0
0
0
0
0
0
0
0
0
0
0
0
0
0
0
0
0
0
0
0
0
0
0
Ingresos por Transferencias
0
0
0
0
0
0
0
0
0
0
0
0
0
0
0
0
0
0
Egresos por Transferencias
0
0
0
0
0
0
0
0
0
0
0
0
0
0
0
0
0
0
-2,775,623
-2,738,468
6,848,176
11,026,330
-1,887,725
-1,798,301
-4,421,908
-2,421,771
-2,245,203
-5,477,192
1,173,967
677,384
1,548,140
2,017,552
-788,350
-2,597,077
962,302
937,659
Presupuesto de Inversiones - FBK
TRANSFERENCIAS NETAS
SALDO ECONOMICO
-476,849
2,604,903
-933,384
0
0
-210,892
0
0
-211,070
0
0
-211,360
0
0
-211,701
-845,023
-478,389
-483,600
Financiamiento Externo Neto
0
0
0
0
0
0
0
0
0
0
0
0
0
0
0
0
0
0
Financiamiento largo plazo
0
0
0
0
0
0
0
0
0
0
0
0
0
0
0
0
0
0
Desembolsos
0
0
0
0
0
0
0
0
0
0
0
0
0
0
0
0
0
0
Servicios de Deuda
0
0
0
0
0
0
0
0
0
0
0
0
0
0
0
0
0
0
Amortizacion
0
0
0
0
0
0
0
0
0
0
0
0
0
0
0
0
0
0
Intereses y comisiones de la deuda
0
0
0
0
0
0
0
0
0
0
0
0
0
0
0
0
0
0
FINANCIAMIENTO NETO
FONDO NACIONAL DE FINANCIAMIENTO DE LA ACTIVIDAD EMPRESARIAL DEL ESTADO FONAFE
Página
SERVICIOS INDUSTRIALES DE LA MARINA IQUITOS S.R.L. PRESUPUESTO EJERCICIO 2013
:
2
2
Fecha Impr : 16/08/2013
Flujo de Caja Aprobado - Formulacion FECHA CIERRE : 15/08/2013
Hora Impr
EN NUEVOS SOLES
HORA CIERRE : 12.00 AM
:
7.53 AM
(C26261908-201315) PRESUPUESTO AÑO 2013
RUBROS
31.12.2010 (REAL)
31.12.2011 (REAL)
31.12.2012 (ESTIMADO)
31.12.2014 31.12.2015 (PROYECTADO) (PROYECTADO) ENERO
FEBRERO
MARZO
ABRIL
MAYO
JUNIO
JULIO
AGOSTO
SETIEMBRE
OCTUBRE
NOVIEMBRE
DICIEMBRE
TOTAL
0
0
0
0
0
0
0
0
0
0
0
0
0
0
0
0
0
0
Desembolsos
0
0
0
0
0
0
0
0
0
0
0
0
0
0
0
0
0
0
Servicio de la Deuda
0
0
0
0
0
0
0
0
0
0
0
0
0
0
0
0
0
0
Amortizacion
0
0
0
0
0
0
0
0
0
0
0
0
0
0
0
0
0
0
Intereses y comisiones de la deuda
0
0
0
0
0
0
0
0
0
0
0
0
0
0
0
0
0
0
-476,849
2,604,903
-933,384
0
0
-210,892
0
0
-211,070
0
0
-211,360
0
0
-211,701
-845,023
-478,389
-483,600
-476,849
2,604,903
-933,384
0
0
-210,892
0
0
-211,070
0
0
-211,360
0
0
-211,701
-845,023
-478,389
-483,600
0
3,000,000
0
0
0
0
0
0
0
0
0
0
0
0
0
0
0
0
476,849
395,097
933,384
0
0
210,892
0
0
211,070
0
0
211,360
0
0
211,701
845,023
478,389
483,600
465,380
312,558
757,353
0
0
177,968
0
0
180,614
0
0
184,021
0
0
187,784
730,387
405,769
439,926
11,469
82,539
176,031
0
0
32,924
0
0
30,456
0
0
27,339
0
0
23,917
114,636
72,620
43,674
Financiamiento corto plazo
Financiamiento Interno Neto Financiamiento Largo PLazo Desembolsos Servicio de la Deuda Amortizacion Intereses y comisiones de la deuda
0
0
0
0
0
0
0
0
0
0
0
0
0
0
0
0
0
0
Desembolsos
0
0
0
0
0
0
0
0
0
0
0
0
0
0
0
0
0
0
Servicio de la Deuda
0
0
0
0
0
0
0
0
0
0
0
0
0
0
0
0
0
0
Amortizacion
0
0
0
0
0
0
0
0
0
0
0
0
0
0
0
0
0
0
Intereses y comisiones de la Deuda
0
0
0
0
0
0
0
0
0
0
0
0
0
0
0
0
0
0
PARTICIPACION TRABAJADORES D.LEGISLATIVO N° 892 DESAPORTE DE CAPITAL EN EFECTIVO
0
0
139,988
0
0
83,248
0
0
0
0
0
0
0
0
0
83,248
85,672
120,000
0
0
0
0
0
0
0
0
0
0
0
0
0
0
0
0
0
0
PAGO DE DIVIDENDOS
0
0
0
0
0
0
0
0
0
0
0
0
0
0
0
0
0
0
Pago de Dividendos de Ejercicios Anteriores Adelanto de Dividendos ejercicio
0
0
0
0
0
0
0
0
0
0
0
0
0
0
0
0
0
0
Financiamiento Corto Plazo
0
0
0
0
0
0
0
0
0
0
0
0
0
0
0
0
0
0
-3,252,472
-133,565
5,774,804
11,026,330
-1,887,725
-2,092,441
-4,421,908
-2,421,771
-2,456,273
-5,477,192
1,173,967
466,024
1,548,140
2,017,552
-1,000,051
-3,525,348
398,241
334,059
SALDO INICIAL DE CAJA
6,330,525
3,078,053
2,944,488
8,719,292
19,745,622
17,857,897
15,765,456
11,343,548
8,921,777
6,465,504
988,312
2,162,279
2,628,303
4,176,443
6,193,995
8,719,292
5,193,944
5,592,185
SALDO FINAL DE CAJA
3,078,053
2,944,488
8,719,292
19,745,622
17,857,897
15,765,456
11,343,548
8,921,777
6,465,504
988,312
2,162,279
2,628,303
4,176,443
6,193,995
5,193,944
5,193,944
5,592,185
5,926,244
0
0
0
0
0
0
0
0
0
0
0
0
0
0
0
0
0
0
-2,775,623
-2,738,468
6,708,188
11,026,330
-1,887,725
-1,881,549
-4,421,908
-2,421,771
-2,245,203
-5,477,192
1,173,967
677,384
1,548,140
2,017,552
-788,350
-2,680,325
876,630
817,659
FLUJO NETO DE CAJA
SALDO DE LIBRE DISPONIBILIDAD RESULTADO PRIMARIO