ISSSD 2014 th
April 13 to 16 , 2014. Cusco, Peru
THERMOLUMINESCENCE PROPERTIES OF ZINC OXIDE OBTAINED BY SOLUTION COMBUSTION SYNTHESIS
Victor Ramón Orante Barrón1, Flor María Escobar Ochoa1 Catalina Cruz Vázquez1 and Rodolfo Bernal2
1
Departamento de Investigación en Polímeros y Materiales Universidad de Sonora Apartado Postal 130, Hermosillo, Sonora 83000 Mexico
[email protected],
[email protected],
[email protected]. 2
Departamento de Investigación en Física Universidad de Sonora Apartado Postal 5-088, Hermosillo, Sonora 83190 Mexico
[email protected].
Abstract
High-dose thermoluminescence dosimetry properties of novel zinc oxide obtained by solution combustion synthesis in a glycine-nitrate process, with a non-stoichiometric value of the elemental stoichiometric coefficient (Фe) are presented in this work. ZnO powder samples obtained were annealed afterwards at 900 °C during 2 h in air. Sintered particles of sizes between ~ 0.5 and ~ 2 μm were obtained, according to scanning electron microscopy results. X-ray diffraction indicates the presence of the hexagonal phase of ZnO for the powder samples obtained, before and after thermal annealing, without any remaining nitrate peaks observed. Thermoluminescence glow curves of ZnO obtained after being exposed to beta radiation consists of two maxima; one located at ~ 149 °C and another at ~ 308 °C, being the latter the dosimetric component of the curve. Dosimetric characterization of non-stoichiometric zinc oxide provided experimental evidence like asymptotic behavior of the TL signal fading for times greater than 16 h between irradiation and the corresponding TL readout, as well 756
ISSSD 2014 th
April 13 to 16 , 2014. Cusco, Peru
as the linear behaviour of the dose response without saturation in the dose interval studied (from 12.5 up to 400 Gy). Such characteristics place ZnO phosphors obtained in this work as a promising material for high-dose radiation dosimetry applications (e.g., radiotherapy and food industry).
Keywords: Thermoluminescence; solution combustion synthesis; zinc oxide.
1.- INTRODUCTION A wide variety of luminescent materials used as thermoluminescent dosimeters (TLD) can be applied in several areas as in the case of environmental and clinical dosimetry (low dose dosimetry), as well as applications related with high radiation doses such as nuclear reactors facilities, food sterilization plants, materials testing and space dosimetry [Chen and McKeever 1997; McKeever et al., 1995]. In the case of high dose dosimetry, as a relevant characteristic, the thermoluminiscence (TL) dose response should not exhibit a sublinear behaviour with a saturation tendency, nor superlinear in the range of interest because the real dose absorbed by the dosimeter can be underestimated or overestimated, respectively. Some materials, in particular conventional TL dosimeters, show a remarkable superlinearity at high dose levels, for this reason, the number of available materials for high dose dosimetry is limited [Chen and McKeever 1997; McKeever et al., 1995]. Nowadays, the search for new materials for high-dose TL dosimetry applications with high saturation limits represents a considerable challenge in the field of materials science.
There is a considerable number of reports regarding the TL response of zinc oxide under exposure with different types of radiation sources [De Muer and Maenhout-van der Vorst 1968; Diwan et al., 1984; Bhushan et al., 1984; Coskun et al., 2004]. Moreover, further investigations related with TL dosimetry features of pure and doped ZnO obtained by different soft chemistry-based methods had been carried out, proposing this oxide as a promising material for high-dose radiation dosimetry applications [Cruz-Vazquez et al., 757
ISSSD 2014 th
April 13 to 16 , 2014. Cusco, Peru
2005; Pal et al., 2006; Bedir 2006]. However, for some co-precipitation chemical methods, the mass yield obtained in each reaction batch is very low and in some cases, lack of reproducibility of the TL glow curve between different reaction batches has been presented.
The solution combustion synthesis (SCS) based on a glycine-nitrate process represents a mechanistic advantage referring to the chemistry of the process in comparison with the combustion using urea and carboxilate azides as fuels. The “zwitterionic” character of glycine allows the effective complexation of metals depending on the ionic size. Alkaline and alkaline-earth ions are more effectively complexed by the carboxylic acid group, while many transitions metals are more effectively complexed by the amino group [Chick et al., 1990].
Thereby, motivated by the antecedents mentioned above, the purpose of this work is to present the high-dose TL dosimetry properties of novel zinc oxide obtained by glycinenitrate solution combustion synthesis.
2.- MATERIALS AND METHODS 2.1.- Zinc oxide synthesis An initial 0.25 M zinc nitrate hexahydrate (Zn(NO3)2∙6H2O, ACS grade, Sigma-Aldrich) solution was prepared using deionized water and poured inside a 400 mL beaker. A mass amount of 0.42 g of glycine (C2H5NO2, ACS grade, Sigma-Aldrich) was weighed and added to the metallic nitrate solution to get a fuel-lean elemental stoichiometric coefficient value (Φe = 1.75) for the fuel-oxidizer mixture [Shea et al., 1996]. The resulting solution was placed in a hot plate and stirred magnetically at 360 RPM during 30 min inside a fume hood. After the stirring process, the solution temperature was increased from room temperature up to 200 °C during 1 h, when most of the water content of the solution was evaporated, the temperature was increased up to 500 °C until a green flame was observed. Once the combustion finished, only the inorganic material powder remained at the bottom
758
ISSSD 2014 th
April 13 to 16 , 2014. Cusco, Peru
of the beaker. The solid within the beaker was then cooled to room temperature and the solid was collected and finally crushed with a pestle in an agate mortar.
2.2.- Thermal annealings Powder samples obtained by the SCS technique were thermally annealed inside a Thermolyne 1300 furnace in air at 900 °C during 2 h. After each annealing, the samples were cooled slowly inside the furnace.
2.3.- Materials characterization X-ray diffraction data were obtained using a Bruker D8 Advance with Cu Ka radiation (λ = 1.542 Å). Scanning electron microscopy (SEM) images were obtained using a JEOL JSM-5410LV equipment. A Risø TL/OSL model TL/OSL-DA-20 unit equipped with a 90
Sr beta radiation source was used to perform beta irradiations, thermoluminescence (TL)
measurements and the TL dosimetry characterization. Aliquots of 60 mg of sample in stainless steel cups were used for the readouts. All irradiations were accomplished using a 5 Gy/min dose rate at room temperature (22 °C). The TL readouts were carried out under N2 atmosphere using a heating rate of 5 °C/s.
3.- RESULTS Figure 1 shows the X-ray diffraction pattern of non stoichiometric powder obtained by SCS with Фe = 1.75. It can be observed that red vertical lines, corresponding with zincite crystalline phase, coincide with the experimental diffraction peaks, which indicates the presence of hexagonal phase of ZnO for the as-synthesized powder samples. The rest of the experimental diffraction peaks could not be identified with any phase of the powder diffraction files (PDF) database.
X-ray diffraction of annealed powder samples obtained by SCS is shown in figure 2. The diffraction pattern consists of sharp and well defined peaks. It can be observed that 759
ISSSD 2014 th
April 13 to 16 , 2014. Cusco, Peru
experimental diffraction data coincide with the data represented by red vertical lines which correspond to hexagonal zinc oxide or zincite.
Figure 1.- X-ray diffraction pattern of powder obtained by SCS with with Фe = 1.75. Red vertical lines indicate the diffraction pattern of zinc oxide, zincite (PDF # 036-1251).
Figure 2.- X-ray diffraction pattern of annealed powders obtained by SCS with with Фe = 1.75. Red vertical lines indicate the diffraction pattern of zinc oxide, zincite (PDF # 0361251).
760
ISSSD 2014 th
April 13 to 16 , 2014. Cusco, Peru
Figure 3 shows the SEM image of annealed non-stoichiometric ZnO powder sample obtained by SCS with Фe = 1.75. Sintered particles of sizes between ~ 0.5 and ~ 2 μm can be observed.
Figure 3.- SEM image of annealed powder of ZnO obtained by SCS with Фe = 1.75. Thermoluminescence glow curves of annealed non-stoichiometric ZnO powder samples after being exposed to beta radiation in the dose range from 12.5 up to 400 Gy are shown in figure 4. At least two maxima are observed, one located at ~ 149 °C and another at ~ 308 °C.
3
12.5 Gy 25 Gy 50 Gy 100 Gy 200 Gy 400 Gy
5
TL Intensity [10 arb. units]
4
2 1 0
100
200 300 o Temperature [ C]
400
Figure 4.- Thermoluminescence glow curves of annealed powder of ZnO obtained by SCS with Фe = 1.75. 761
ISSSD 2014 th
April 13 to 16 , 2014. Cusco, Peru
The integrated TL as a function of the dose, namely, the dose response of non-
10 5
7
Integrated TL [10 arb. units]
stoichiometric ZnO is showed in Figure 5.
1 0.5
10
25
50
75 100
250
Dose [Gy]
Figure 5.- Dose response of ZnO obtained by SCS with Фe = 1.75.
Each point in the plot represents the integrated TL or the area beneath each TL glow curve shown in figure 4. A linear behaviour in the 12.5 – 200 Gy dose interval is observed. There is a sublinear behaviour evidence for doses above 200 Gy.
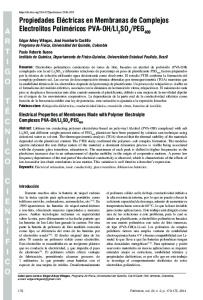
Figure 6 shows the TL glow curve evolution obtained previously exposing the powder ZnO samples to 50 Gy of beta radiation, increasing the elapsed time between each irradiation and the corresponding TL readout until 16 h.
It can be observed that TL intensity of the component located at ~ 149 °C decreases in a higher proportion as time increases, compared to the maximum at ~ 308 °C which is a more stable component since represents recombination of charge carriers such as electrons previously trapped at deeper localized metastable energy states within the band gap of ZnO.
762
ISSSD 2014 th
April 13 to 16 , 2014. Cusco, Peru
0 min 5 min 15 min 30 min 60 min 120 min 240 min 480 min 960 min
TL Intensity [10 arb. units]
1.0 0.8
5
0.6 0.4 0.2 0.0
100
200
300
400
o
Temperature [ C]
Figure 6.- TL glow curve evolution of ZnO, previously exposed to 50 Gy of beta radiation after each elapsed time between irradiation and the corresponding TL readout (inner text box). Figure 7 shows the total TL signal as a function of the elapsed time between irradiation and the corresponding TL readout of ZnO. Each point in the plot represents the integrated TL or the area beneath each TL glow curve shown in figure 6. The signal faded down 25 %
7
Integrated TL [10 arb. units]
past 9 h after irradiation, with an asymptotic trend for times longer than 16 h.
2.2 2.0 1.8 1.6 1.4 1.2 1.0
0
200
400 600 Time [min]
800
1000
Figure 7.- Integrated TL as a function of the elapsed time between irradiation and the corresponding TL readout of ZnO obtained by SCS with Фe = 1.75.
763
ISSSD 2014 th
April 13 to 16 , 2014. Cusco, Peru
4.- DISCUSSION Experimental evidence obtained by X-ray diffraction indicates the presence of the hexagonal phase of ZnO for the powder samples obtained, before and after thermal annealing (figures 1 and 2), with a remarkable phase purity for the annealed powder samples, since remaining nitrate or organic material diffraction peaks were not observed. Not identified diffraction peaks in as-synthesized ZnO powder samples are possibly due to the presence of complexes containing amino, nitrosyl, hydroxo, oxo and other ligands formed from the initial reagents in the combustion process. ZnO crystalization after sintering was efficient according to peak sharpness in comparison with the broad peaks of as-synthesized ZnO. According to the result shown in figure 3, it can be observed sintering was carried out efficiently according to the SEM image, there is a well defined particle form, without visible porosity. It is worth mentioning that very similar morphologies were obtained from powder samples of different SCS reaction batches using the same value of Фe. TL glow curve maxima observed in figure 4 shift their positions to lower temperatures as the dose increases, experimental evidence that second-order kinetics is predominating in the TL processes, although further glow curve deconvolution studies are necessary to support such assumption. The maximum located at ~ 308 °C is expected to be the stable peak, since it is located at a temperature higher than 200 °C [McKeever 1985]. It is worth mentioning that there is no evidence of saturation in the 12.5-200 Gy dose interval for ZnO obtained in the present work.
TL glow curves obtained in this work are different compared to the curves of ZnO synthesized by a combustion process, but using oxalyl dihydrazide (C2H6N4O2) as fuel, reported by A. Jagannatha Reddy et al. TL glow curve consists of a single broad peak located at ~ 343 °C. Also, there is evidence of TL signal saturation as the dose increases in the dose interval studied (10-50 Gy) [Jagannatha Reddy et al., 2011], which is lower than the interval used in the present study. 764
ISSSD 2014 th
April 13 to 16 , 2014. Cusco, Peru
A further study is necessary to carry out to determine which is the optimal annealing prior to irradiation in order to eliminate the effect of the peak located at ~ 149 °C and therefore, the possible sublinear trend for doses above 200 Gy (figure 5).
The asymptotic behaviour for times longer than 16 h observed in figure 7, is mainly due to the ~ 308 °C peak which can be suitable for dosimetry applications such as medical (e.g., radiotherapy) and industrial (e.g., food irradiation industry)
5.- CONCLUSIONS It was feasible to synthesize through a glycine-nitrate combustion process novel nonstoichiometric ZnO phosphors with phase purity, and with remarkable TL dosimetry properties, according to the results obtained in this work. Dose response without saturation evidence and a linear trend for doses up to 200 Gy as well as the asymptotic behaviour of the TL fading for times longer than 16 h, are experimental evidence for proposing annealed ZnO as a promising material aimed for high-dose radiation dosimetry applications such as medical and industrial.
Acknowledgments The corresponding author gratefully acknowledge the financial support to this work from PROMEP through grant: PROMEP/103.5/11/4462.
765
ISSSD 2014 th
April 13 to 16 , 2014. Cusco, Peru
REFERENCES
Bedir M. (2006). Characterization of undoped and Cu-doped ZnO thin films deposited on glass substrates by spray pyrolysis. Chinese Physics Letters 23: 939-942. Bhushan S; Diwan D; Kathuria SP. (1984). Thermoluminescence of ZnO:Pr and ZnO:Gd under UV, β- and γ-ray irradiations. Physica Status Solidi. A, Applied Research 83 (2): 605-611. Chen R; McKeever SWS. THEORY OF THERMOLUMINESCENCE AND RELATED PHENOMENA. Singapore. World Scientific. (1997). Chick LA; Pederson LR; Maupin GD; Bates JL; Thomas LE; Exarhos GJ. (1990). Glycinenitrate combustion synthesis of oxide ceramic powders. Materials Letters 10: 6-12. Coskun C; Look DC; Farlow GC; Sizelove JR. (2004). Radiation hardness of ZnO at low temperatures. Semiconductor Science and Technology 19: 752. Cruz-Vazquez C; Bernal R; Burruel-Ibarra SE; Grijalva-Monteverde H; Barboza-Flores M. (2005). Thermoluminescence properties of new ZnO nanophosphors exposed to beta radiation. Optical Materials 27: 1235-1239. De Muer D; Maenhout-van der Vorst W. (1968). Thermoluminescence of ZnO powder. Physica 39 (1): 123-132. Diwan D; Bhushan S; Kathuria SP. (1984). Thermoluminescence of ZnO:Cu, La under UV and γ-ray irradiation. Crystal Research and Technology 19 (9): 1265-1269. Jagannatha Reddy A; Kokila MK; Nagabhushana H; Rao JL; Shivakumara C; Nagabhushana BM; Chakradhar RPS. (2011). EPR, thermo and photoluminescence properties of ZnO nanopowders. Spectrochimica Acta Part A: Molecular and Biomolecular Spectroscopy 81: 59-63. McKeever SWS. THERMOLUMINESCENCE OF SOLIDS. New York. Cambridge University Press. (1985). McKeever SWS; Moscovitch M; Townsend PD. THERMOLUMINESCENCE DOSIMETRY MATERIALS: PROPERTIES AND USES. Ashford. Nuclear Technology Publishing. (1995). Orante-Barron VR; Cruz-Vazquez C; Bernal R; Denis G; Yukihara EG. (2010). Thermoluminescence properties of novel La2O3 phosphor obtained by solution combustion synthesis. Materials Research Society Symposium Proceedings. 1278: 74-79. 766
ISSSD 2014 th
April 13 to 16 , 2014. Cusco, Peru
Pal U; Melendrez R; Chernov V; Barboza-Flores M. (2006). Thermoluminescence properties of ZnO and ZnO:Yb nanophosphors. Applied Physics Letters 89: 183118183118-3. Shea LE; McKittrick J; Lopez OA. (1996). Synthesis of red emitting, small particle size luminescent oxides using an optimized combustion process. Journal of the American Ceramic Society 79: 3257-3265.
767